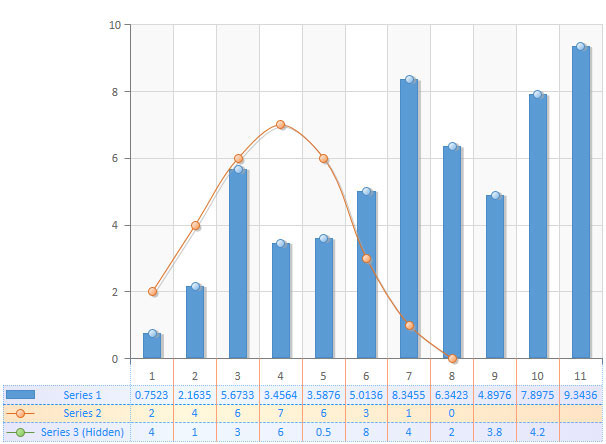
Chart Data Table
 BCGControlBar Pro (MFC)
BCGSuite (MFC)
 BCGControlBar for .NET
You can display the chart series data in the grid located below the chart X axis. This feature is available for the following chart types only: 2D Line, 2D Column, 2D Area, and Stock. The implementation includes:
- The ability to display data from several chart series, including invisible ones.
- Customizable data table appearance. You can specify the data table colors, font, grid lines, and other options.
- Smart data label rounding means that the chart automatically generates visually appealing labels for the data points in the table.
- Print and print preview support.
To show or hide the data table in your chart, simply call the 'CBCGPChartVisualObject::ShowDataTable' method. The second optional parameter, 'pDataTableAreaFormat,' allows you to customize the data table's appearance and content.
Sample code:
CBCGPChartVisualObject* pChart = m_wndChart.GetChart();
ASSERT_VALID(pChart);

BCGPChartFormatDataTable formatDataTable;
formatDataTable.m_bInterlaceRows = TRUE;

pChart->ShowDataTable(TRUE, &formatDataTable);