General Chart Features
 BCGControlBar Pro (MFC)
BCGSuite (MFC)
 BCGControlBar for .NET
The chart control provides the following basic and advanced features:
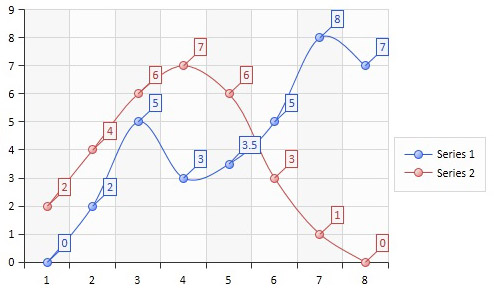
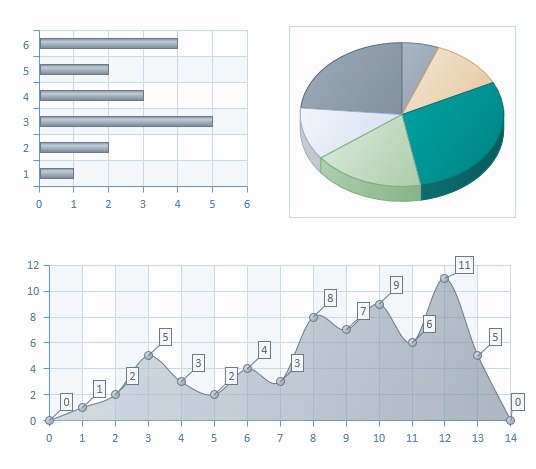
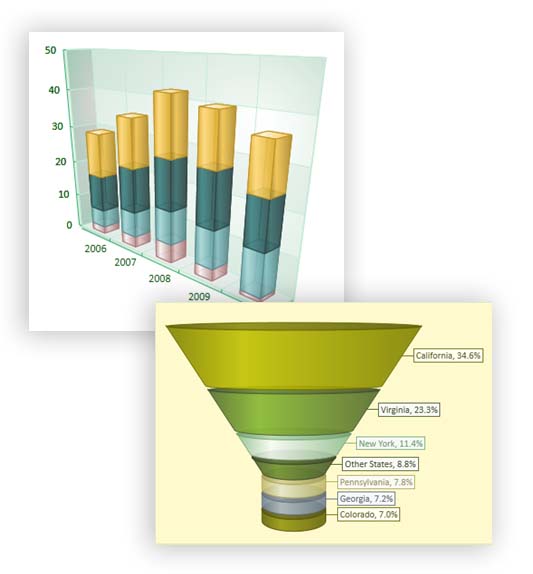
- 2D and 3D charts.
- Unlimited number of series.
- An unlimited number of data points can be included in the series.
- Convert between compatible series on the fly (without clearing and adding new data).
- Ability to display different series types on the same chart area.
- Customizable data markers for the data points.
- Customizable data labels for the data points.
- The chart legend can include individual data points.
- Tooltip support.
- The smart labels are supported.
- Missed (not specified) data support.
Real-Time Charting
Data point values can be modified on the fly.
History Mode
A series automatically removes data points when the specified history depth is reached.
Automatic Coloring of Series and Data Points
All series elements (outline, fill, and text colors) are automatically colored according to the currently selected color theme.
Technical Indicators:
- Moving averages (simple, exponential, smoothed, linear weighted)
- Stochastic Oscillator
- RSI indicator (smoothed, exponential, simple).
- Bollinger Bands
- MACD
- custom indicators