BCGControlBar Pro (MFC)
BCGSuite (MFC)
BCGControlBar for .NET
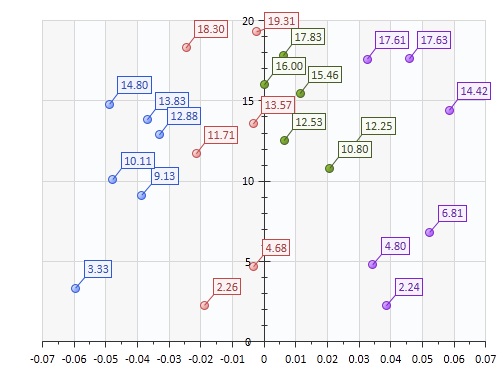
Point Chart The point chart represents the data on two axes: X and Y. Each point is indicated by the color of the series that owns it.
Point Chart
The point chart represents the data on two axes: X and Y. Each point is indicated by the color of the series that owns it.
 BCGControlBar Pro (MFC) BCGSuite (MFC)
 BCGControlBar for .NET