Stock Chart (Signals and Technical Indicators)
 BCGControlBar Pro (MFC)
BCGSuite (MFC)
 BCGControlBar for .NET
The following chart formulas are implementing stock charts with signals and technical indicators:
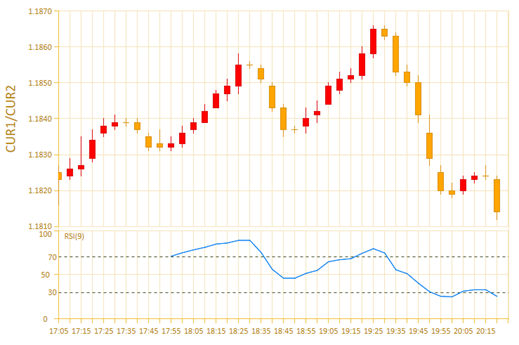
- CBCGPChartRSIFormula. Implements RSI financial indicator.
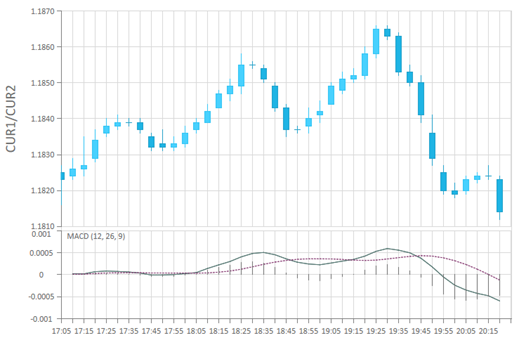
- CBCGPChartMACDFormula. The formula is displayed as a histogram series and represents the difference between slow and rapid EMA. To show the signal line, you need to create an MA formula for the MACD series.
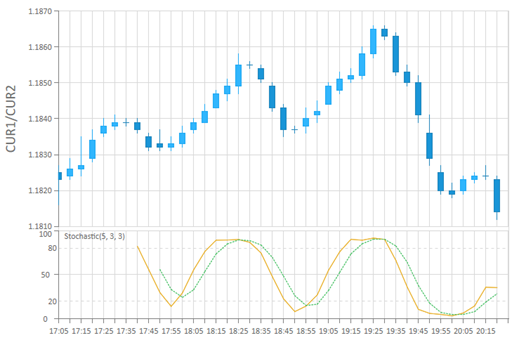
- CBCGPChartStochasticFormula. Implements Stochastic Oscillator.
RSI (Relative Strength Index) formula:
MACD (Moving Average Convergence/Divergence Oscillator) formula:
Stochastic indicator: