Chart Axis
 BCGControlBar Pro (MFC)
BCGSuite (MFC)
 BCGControlBar for .NET
Name
- An axis can display or hide its name.
- You can customize the appearance of Axis Name by setting its fill, outline, and text colors, as well as the text font and direction.
Grid Lines
- Major grid lines for an axis can be shown or hidden.
- Minor grid lines for an axis can be shown or hidden.
- The colors of major and minor grid lines can be customized.
Major Grid Line Interlacing
- The space between major grid lines can be filled by a distinct color (by default it's taken from the current color theme).
- You can specify the first interval to fill.
- You can specify the fill step (how many intervals are skipped).
Axis Line and Tick Marks
- Customizable major and minor tick mark size
- Major and minor tick marks can be hidden or have one of the following types:
- Cross the Axis
- Display outside the Axis
- Display inside the Axis
- The outline color, size, and stroke style of each axis line and tick mark can be customized.
Axis Labels
- An Axis supports the following label display modes:
- No labels.
- Labels next to axis.
- Labels low (outside the plot area, near the minimum display value).
- Labels high (outside the plot area, near the maximum display value).
- Textual labels
- Custom format for axis labels
- Custom outline, fill, and text colors for axis labels, as well as custom font size and direction.
- You can completely customize label drawing by overriding several virtual methods.
Date/Time Mode
The X axis can be set to the "date" mode. In this mode it treats the X component from related series as date/time values, calculates the major unit, and formats the labels accordingly.
Display Data between Tick Marks
This mode can be turned on if the Series X component is missing and/or automatically treated as a category index. In this case, the X coordinates of the data points are "shifted" right to half the major unit size. This mode is a default for column and bar series.
Automatic and Manual Scaling
- It's possible to specify a fixed major unit for an axis.
- You can specify a custom number of minor units.
- Axes support a fixed grid size. In this mode, you specify the distance between major grid lines in pixels and how many data points should be displayed within that interval. It's usable when you create real-time charts and/or enable history mode for series.
Fixed Display Range
- You can specify a fixed display range for an axis, and it will automatically calculate the required scale.
- You can specify a fixed maximum display value separately.
- You can specify a fixed minimum display value separately.
Cross Type
- It's possible to specify where an axis crosses its perpendicular axis.
- There are four supported cross types:
- Automatic (an axis automatically calculates the most suitable cross value based on perpendicular axis range)
- Maximum Displayed Value
- At Value (you can specify the cross value based on application-specific preferences)
- Ignore (the axis is always displayed at its default position).
Logarithmic Scales
Logarithmic scales of any base.
Reverse Order
Any axis can display values in reverse order.
Axis Rotation
Any series type can be displayed correctly when the X axis is vertical and the Y axis is horizontal.
Secondary Axes
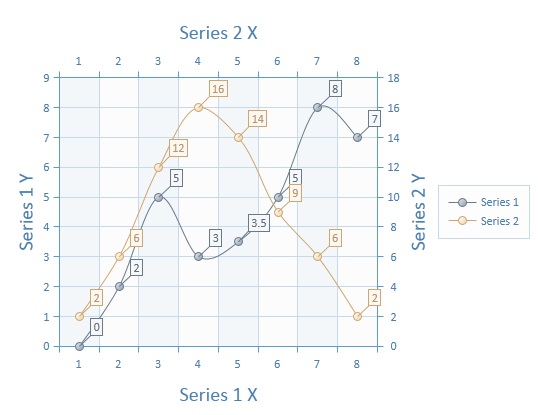
- The Chart control creates by default four axes—two primary and two secondary. The default positions for secondary axes are right (Y) and top (X), respectively. You can force the display of the secondary axes even if they do not display any series.
- Any series can be displayed on primary or secondary axes, and this option can be chosen at runtime.
Multiple Custom Axes
- It's possible to create and add to a particular chart as many custom axes as you wish.
- Each axis (including the standard primary and secondary) can be positioned within the plot area using the top and bottom (which will be right or left for horizontal axes) offsets specified in percents.
- Any series can be assigned a pair of custom axes and thus be displayed in the specified area of the main plot area.
- Multiple vertical axes may have one horizontal related axis (and vice versa). In this way, different series having similar X components (for example, date/time) can be displayed on the same plot area separately.
Axis scale breaks.
Scale breaks can be generated automatically or added manually.
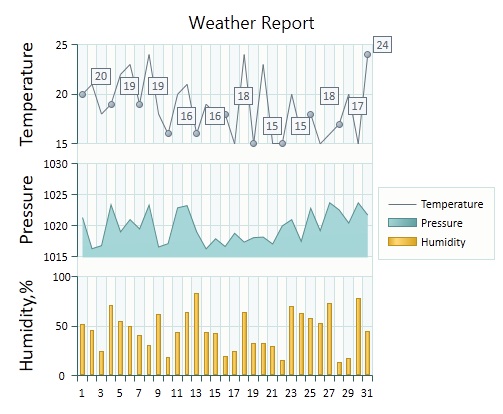
Primary and Secondary Axes:
Custom Cross Type:
Multiple Axes: